Saturday, May 21, 2011

Final Day of Hurricne Week, Baja time

(Click on images in this article to expand)

Hurricane Linda from space in the Eastern Pacific
The Eastern Pacific Hurricane Season begins May 15th, but residents of Baja will scoff about any threat so early in the season. I've heard tribal knowledge like, "Hurricanes never come up the Sea of Cortez before September 1st." Well, right off the bat, my first hurricane, Ignacio, proved that one wrong in 2003.
The earliest Tropical Cyclone (one of Tropical Storm intensity or greater) to make landfall in Baja was TS Calvine on July 8th, 1993. The earliest hurricane to make landfall in Baja was Category 1 Hurricane Doreen in 1977. The most powerful storm to hit Baja was Kiko in 1989, the only Category 3 storm to ever make landfall in Baja. The dealiest storm was Hurricane Lisa in 1976. Lisa was a Category 4 Hurricane that passed up the Sea of Cortez and indirectly resulted in the deaths of thousands in La Paz.
So, we did research and here's the scientific straight scoop. We went to the NHC's Historical Hurricane Plotter which has data on tropical weather compiled from 1948 to 2008. We looked at plots of tropical storms though Category 5 hurricanes that passed within 150 miles of Baja. To confirm our data, it was checked against the Unisys data complied independently.
There is a map for each month of the season, click on the map for an enlarged view of storms tracked during that month. Each table shows the year of the storm, the first date of it's highest wind speed and the highest Saffir-Simpson Scale Category rating the storm achieved. This is not necessarily the storm's rating when it made landfall in Baja California Sur. The storms are sorted by the day they achieved maximum strength, showing what part of the month is most prone to storms.
May Hurricanes
Hurricane Georges in the Caribbean 1997Let's Start with May, that's an easy one. Since 1951 not a single tropical storm or hurricane has passed within 250 miles of Baja.
In June the Eastern Pacific is starting to really warm up and the storm activity increases. By mid June hurricanes become a possibility in Baja, although still pretty remote. The last time a June hurricane hit Baja was in 1958. The early season storm packed winds of 85 mph as it passed within 25 miles of Cabo San Lucas, which wasn't much more than a few fishing huts at the time.
June Storms
YEAR DAY STORM NAME WIND SPEED (KTS) CAT
1958 15 Not Named 25 TD
1959 12 Not Named 45 TS
1960 25 BONNY 45 TS
1960 25 BONNY 45 TS
1974 21 CONNIE 25 TD
1990 23 DOUGLAS 30 TD

In July the water in the Sea of Cortez is warmer. But hurricanes in our hemisphere want to go to the west because of their rotation. The jet stream usually doesn't drop southward across Baja until late August. Historically speaking, July is a safe month too, as the storms move harmlessly out into the Pacific and dissipate. There has been one Category 2 hurricane brush past Magdalena Bay and make landfall north of San Ignacio back in July of 1954. Tropical storm Calvin hit East Cape in 1993 and another tropical storm Calvin hit Todos Santos in 1981. (yes, the same day twelve years apart!) Ok, we can make it though July without a hurricane.
July Storms
YEAR DAY STORM NAME WIND SPEED (KTS) CAT
1950 6 Not Named 75 H1
1952 19 Not Named 45 TS
1954 16 Not Named 75 H1
1958 29 Not Named 45 TS
1964 7 NATALIE 45 TS
1970 18 HELGA 50 TS
1974 18 FRANCESCA 60 TS
1974 18 GRETCHEN 50 TS
1981 8 CALVIN 40 TS
1984 7 FAUSTO 90 H2
1984 11 GENEVIEVE 65 H1
1985 4 FEFA 60 TS
1989 27 FLOSSIE 25 TD
1993 8 CALVIN 50 TS
1998 18 CELIA 45 TS
2005 20 EUGENE 50 TS
2006 25 EMILIA 50 TS
2008 3 DOUGLAS 30 TD


Well, dream on if you think the luck will hold though August. I heard it said just days before Hurricane Ignacio in 2003  "...it was no concern, storms never come up the Sea until after September 1st." That is nothing but an old wives tale. By the end of August we can start to get into some serious hurricane weather.
Anyone who has spent the summer in Baja knows, about August 15th the days become still and humid, and this is in addition to near 100 degree heat every day. Thunderstorms appear regularly over the mountains between Cabo San Lucas and La Paz. The earliest hurricane to make landfall in Baja Sur was August 15th and the latest was October 17th, thus defining Baja's hurricane season. However, a Category 1storm passed just 30 miles south of Cabo in 1958, certainly close enough to deliver some punch to the peninsula.
Hurricane Fran from space - off the coast of FloridaThe warm water of the Sea can be in the upper 80°'s by late August and this becomes a very strong hurricane magnet. Storms that generate NW of Acapulco can sometimes get stuck  'inside' and travel up the Sea. Hurricane Ignacio did exactly that on August 26, 2003.
The good news is August tropical cyclones in Baja are still rare. The upper atmosphere steering winds are still moving eastward far north of the hurricane track and a majority of the storms move off into the colder waters of the Pacific and spin apart.
August Storms
Hurricane and tropical storm tracks affecting Baja California
However, August can spawn monster storms too, like Kiko in 1989. Kiko made it to Category 3 has it churned up the Sea of Cortez and  made landfall on the East Cape with winds in excess of 120 MPH. Kiko was the ONLY category 3 storm to ever make landfall in Baja.


to ever make landfall in Baja.
YEAR DAY STORM NAME WIND SPEED (KTS) CAT
1960 19 DIANA 75 H1
1960 19 DIANA 75 H1
1965 31 EMILY 45 TS
1967 31 KATRINA 75 H1
1968 18 HYACINTH 45 TS
1969 23 EMILY 50 TS
1971 11 KATRINA 50 TS
1977 15 DOREEN 65 H1
1981 29 IRWIN 35 TS
1981 30 IRWIN 30 TD
1988 18 JOHN 30 TD
1989 26 KIKO 45 H3
1993 24 HILARY 40 TS
1995 11 FLOSSIE 70 H1
2000 15 ILEANA 60 TS
2003 23 IGNACIO 55 TS
2003 24 IGNACIO 60 TS
2008 24 JULIO 40 TS
September is the month to be a storm watcher in Baja. More than 150 tropical storms have passed within 250 miles of Cabo San Lucas since 1950. Many of them were just tropical storms, but September is the peak of the storm season.
By mid September the jet stream has dropped well down into Baja Sur before it makes a dramatic turn to the east. While I was plotting hurricane Marty the computer models forecast a continued NW progress harmlessly into the Pacific. Friday afternoon I noticed a drop to the south in the jet stream on the US Navy plots. These high speed upper air currents came almost as far as Magdalena Bay, then turn 90° east. That Friday night the BajaInsider predicted that Marty would not continue into the Pacific, but would turn and cross the peninsula south of Magdalena Bay. Marty hit the eastward winds south of the jet stream and banked against it's spin, progressively to the east. Marty arrived in La Paz on Monday morning. (thanks to my amateur weather tutor, Jim from Sea Witch!)
The jet stream can make a hurricane turn and it can tear it apart. The central column of convection is the engine that drives a hurricane. Hard turns or strong high altitude winds can disrupt the column and spin the storm apart. As the northern hemisphere cools these upper atmosphere steering winds drop further down Baja before turning east. The combination of these winds and energy still built up in the tropical regions are what make the period from September 15th to October 15th the peak of our storm season.

September Storms
YEAR DAY STORM NAME WIND SPEED (KTS) CAT
1949 10 Not Named 75 H1
1953 16 Not Named 75 H1
1957 21 Not Named 45 TS
1958 11 Not Named 45 TS
1959 9 Not Named 75 H1
1962 21 CLAUDIA 45 TS
1964 7 TILLIE 45 TS
1965 25 HAZEL 45 TS
1966 28 KIRSTEN 45 TS
1969 5 FLORENCE 45 TS
1969 10 GLENDA 55 TS
1971 7 NANETTE 70 H1
1973 25 IRAH 90 H2
1976 30 LIZA 120 H4
1978 25 PAUL 40 TS
1986 23 NEWTON 70 H1
1988 7 DEBBY 25 TD
1993 12 LIDIA 85 H2
1995 4 HENRIETTE 80 H1
1995 14 ISMAEL 70 H1
1995 15 ISMAEL 70 H1
1996 13 FAUSTO 85 H2
1998 2 ISIS 60 TS
1998 2 ISIS 65 H1
1999 7 GREG 65 H1
2000 17 MIRIAM 30 TD
2001 27 JULIETTE 80 H1
2003 22 MARTY 75 H1
2006 1 JOHN 100 H3
2007 4 HENRIETTE 75 H1
2007 24 IVO 25 L
2008 11 LOWELL 30 TD

Once we get to October you would think that the season is winding down. Well, not exactly. The threat of tropical weather extends through the entire month of October. It is said the British Privateer Cromwell and Spanish explorer Cabrillo were taken by surprise in a late season storms.
Hurricane Nora off the coast of BajaBy October the Sea of Cortez has reached it's high temperature, acting as a magnet to the warm water hungry storms. In addition the high altitude steering winds now have enough strength to overpower the storms desire to head west. One look at the storm plot for October and you can see what I mean.  There are fewer storms than in September, but the path moves them right over Baja.
October Storms
YEAR DAY STORM NAME WIND SPEED (KTS) CAT
1955 2 NOTNAMED 45 TS
1958 3 NOTNAMED 75 H1
1958 4 NOTNAMED 75 H1
1962 4 DOREEN 75 H1
1962 4 DOREEN 75 H1
1963 18 MONA 75 H1
1967 13 OLIVIA 75 H1
1968 2 PAULINE 75 H1
1976 1 LIZA 120 H4
1976 28 NAOMI 40 TS
1978 5 ROSA 60 TS
1981 7 LIDIA 45 TS
1984 3 POLO 40 TS
1985 8 WALDO 75 H1
1986 1 PAINE 80 H1
1986 2 PAINE 80 H1
1987 1 PILAR 30 TD
1990 2 RACHEL 55 TS
1998 19 MADELINE 35 TS
2005 5 OTIS 20 L
2006 25 PAUL 40 TS
2008 11 NORBERT 95 H2
The good news is that by November 1st, like a line in the sand, the threat is over. Since 1950 only three tropical storms have even made it to within 250 miles of Cabo, none of them making land or achieving hurricane strength.
Monster hurricane Bonnie in the Atlantic


November Storms
YEAR DAY STORM NAME WIND SPEED (KTS) CAT
1951 29 NOTNAMED 45 TS
1970 4 SELMA 50 TS
1991 12 NORA 30 TD


Friday, May 20, 2011

What is it like to go through a hurricane?

  • 96 hours before landfall
    At first there aren't any apparent signs of a storm. The barometer is steady, winds are light and variable, and fair weather cumulus clouds dot the sky. But the perceptive observer will note a swell on the ocean surface of about a meter (3 feet) in height with a wave coming ashore every ten seconds. These waves race out far ahead of a storm at sea, but could easily be masked by locally wind driven waves.
  • 72 hours before landfall
    Little has changed, except that the swell has increase to about 2 meters (6 feet) in height and the waves now come in every nine seconds. This means that the storm, still far over the horizon, is approaching.
  • 48 hours before landfall
    If anything, conditions have improved. The sky is now clear of clouds, the barometer is steady, and the wind is almost calm. The swell is now about 3 m (9 feet) and coming in every 8 seconds. A hurricane watch is issued, and areas with long evacuation times are given the order to begin.
  • 36 hours before landfall
    The first signs of the storm appear. The barometer is falling slightly, the wind is around 5 m/s (10 kts, 11 mph), and the ocean swell is about 4m (13 feet) in height and coming in 7 seconds apart. On the horizon a large mass of white cirrus clouds appear. As the veil of clouds approaches it covers more of the horizon. A hurricane warning is issued and low lying areas and people living in mobile homes are ordered to evacuate.
  • 30 hours before landfall
    The sky is now covered by a high overcast. The barometer is falling at .1 millibar per hour (.003 inches of Hg/hr), and the winds pick up to about 10 m/s (20 kts, 23 mph). The ocean swell, coming in only 5 seconds apart, is beginning to be obscured by wind driven waves, and small whitecaps begin to appear on the ocean surface.
  • 24 hours before landfall
    In addition to the overcast, small low clouds streak by overhead. The barometer is falling by .2 mb/hr (.006"Hg/hr), the wind picks up to 15 m/s (30 kts, 34 mph). The wind driven waves are covered in whitecaps and streaks of foam begin to ride over the surface. Evacuations should be completed and final preparations made by this time.
  • 18 hours before landfall
    The low clouds are thicker and bring driving rain squalls with gusty winds. The barometer is steadily falling at half a millibar per hour (.015 "Hg/hr), and the winds are whistling by at 20 m/s (40 kts, 46 mph). It is hard to stand against the wind.
  • 12 hours before landfall
    The rain squalls are more frequent and the winds don't diminish after they depart. The cloud ceiling is getting lower, and the barometer is falling at 1 mb/hr (.029 "Hg/hr). The wind is howling at hurricane force at 32 m/s (64 kts, 74 mph), and small, loose objects are flying through the air and branches are stripped from trees. The sea advances with every storm wave that crashes ashore and the surface is covered with white streaks and foam patches.
  • 6 hours before landfall
    The rain is constant now and the 40 m/s wind (80 kts, 92 mph) drives it horizontally. The barometer is falling 1.5 mb/hr (.044 "Hg/hr), and the storm surge has advanced above the high tide mark. It is impossible to stand upright outside without bracing yourself, and heavy objects like coconuts and plywood sheets become airborne missiles. The wave tops are cut off and make the sea surface a whitish mass of spray.
  • 1 hour before landfall
    It didn't seem possible, but the rain has become heavier, a torrential downpour. Low areas inland become flooded from the rain. The winds are roaring at 45 m/s (90 kts, 104 mph), and the barometer is free-falling at 2 mb/hr (.058 "Hg/hr). The sea is white with foam and streaks. The storm surge has covered coastal roads and 5 meter (16 foot) waves crash into buildings near the shore.
  • The eye
    Just as the storm reaches its peak, the winds begin to slacken, and the sky starts to brighten. The rain ends abruptly and the clouds break and blue sky is seen. However the barometer continues falling at 3 mb/hr (.09 "Hg/hr) and the storm surge reaches the furthest inland. Wild waves crash into anything in the grasp of the surge. Soon the winds fall to near calm, but the air is uncomfortably warm and humid. Looking up you can see huge walls of cloud on every side, brilliant white in the sunlight.
    At this point, the barometer stops falling and in a moment begins to rise, soon as fast as it fell. The winds begin to pick up slightly and the clouds on the far side of the eyewall loom overhead.
  • 1 hour after landfall
    The sky darkens and the winds and rain return just a heavy as they were before the eye. The storm surge begins a slow retreat, but the monstrous waves continue to crash ashore. The barometer is now rising at 2 mb/hr (.058 "Hg/hr). The winds top out at 45 m/s (90 kts, 104 mph), and heavy items torn loose by the front side of the storm are thrown about and into sides of buildings that had been in the lee before the eye passed.
  • 6 hours after landfall
    The flooding rains continue, but the winds have diminished to a 'mere' 40 m/s (80 kts, 92 mph). The storm surge is retreating and pulling debris out to sea or stranding sea borne objects well inland. It is still impossible to go outside.
  • 12 hours after landfall
    The rain now comes in squalls and the winds begin to diminish after each squall passes. The cloud ceiling is rising, as is the barometer at 1 mb/hr (.029 "Hg/hr). The wind is still howling at near hurricane force at 30 m/s (60 kts, 69 mph), and the ocean is covered with streaks and foam patches. The sea level returns to the high tide mark.
  • 24 hours after landfall
    The low clouds break into smaller fragments and the high overcast is seen again. The barometer is rising by .2 mb/hr (.006"Hg/hr), the wind falls to 15 m/s (30 kts, 34 mph). The surge has fully retreated from land, but the ocean surface is still covered by small whitecaps and large waves.
  • 36 hours after landfall
    The overcast has broken and the large mass of white cirrus clouds disappears over the horizon. The sky is clear and the sun seems brilliant. The barometer is rising slightly, the wind are a steady 5 m/s (10 kts, 11 mph). All around are torn trees and battered buildings. The air stinks of dead vegetation and muck that was dredged by the storm from the bottom of the sea to cover the shore. The all clear is given.

Thursday, May 19, 2011

Quote for CPC Outlook

The 2011 eastern Pacific hurricane season outlook is an official product of the National Oceanic and Atmospheric Administration (NOAA) Climate Prediction Center (CPC), and is produced in collaboration with scientists from the NOAA National Hurricane Center (NHC). The eastern Pacific hurricane region covers the eastern North Pacific Ocean east of 140oW north of the equator.
Interpretation of NOAA’s eastern Pacific hurricane season outlook
This outlook is general guide to the expected overall activity during the upcoming hurricane season. It is not a seasonal hurricane landfall forecast, and it does not imply levels of activity for any particular region.
Preparedness
Hurricane disasters can occur whether the season is active or relatively quiet. It only takes one hurricane (or even a tropical storm) to cause a disaster. Therefore, residents, businesses, and government agencies of coastal and near-coastal regions are urged to prepare for every hurricane season regardless of this, or any other, seasonal outlook. NOAA, the Federal Emergency Management Agency (FEMA), the NHC, the Small Business Administration, and the American Red Cross all provide important hurricane preparedness information on their web sites.

NOAA does NOT make seasonal hurricane landfall predictions
NOAA does not make seasonal hurricane landfall predictions. Hurricane landfalls are largely determined by the weather patterns in place as the hurricane approaches, which are only predictable when the storm is within several days of making landfall.

Nature of this Outlook and the “likely” ranges of activity
This outlook is probabilistic, meaning the stated “likely” ranges of activity have a certain likelihood of occurring. The seasonal activity is expected to fall within these ranges in 7 out of 10 seasons with similar climate conditions and uncertainties to those expected this year. They do not represent the total possible ranges of activity seen in past similar years.

This outlook is based on 1) predictions of large-scale climate factors and conditions known to be strong indicators of seasonal eastern Pacific hurricane activity. The outlook also takes into account uncertainties inherent in such climate outlooks.

Sources of uncertainty in the seasonal outlooks
  1. Predicting El Niño and La Niña (also called ENSO) impacts is an ongoing scientific challenge facing climate scientists today. Such forecasts made during the spring generally have limited skill.
  2. Many combinations of named storms and hurricanes can occur for the same general set of climate conditions. For example, one cannot know with certainty whether a given climate signal will be associated with several short-lived storms or fewer longer-lived storms with greater intensity.
  3. Weather patterns that are unpredictable on seasonal time scales can sometimes develop and last for weeks or months, possibly affecting seasonal hurricane activity.
2011 Eastern Pacific Hurricane Outlook Summary
NOAA’s 2011 Eastern Pacific Hurricane Season Outlook indicates a 70% chance of a below-normal season, a 25% chance of a near-normal season, and only a 5% chance of an above normal season. See NOAA definitions of above, near-, and below-normal seasons. The eastern Pacific hurricane region covers the eastern North Pacific Ocean east of 140oW north of the equator.
This outlook is based on the analysis and prediction of two main climate signals:
Climate patterns similar to those expected this year have historically produced a wide range of activity. Allowing for uncertainties, we estimate a 70% chance of occurrence for each of the following ranges of activity this season:
  • 9-15 named storms,
  • 5-8 hurricanes,
  • 1-3 major hurricanes,
  • An ACE range 45%-105% of the median.
The seasonal activity is expected to fall within these ranges in 7 out of 10 seasons with similar climate conditions and uncertainties to those expected this year. They do not represent the total possible ranges of activity seen in past similar years.
The 1981-2010 averages for the eastern Pacific hurricane season are 15-16 named storms, 8-9 hurricanes, and 4 major hurricanes.
There will be no further updates to this outlook.
DISCUSSION
1. Expected 2011 Activity
This Outlook is a general guide to the expected overall activity for the 2011 eastern Pacific hurricane season. It is not a seasonal hurricane landfall forecast, and it does not imply levels of activity for any particular area.
The climate factors expected to guide the 2011 eastern Pacific hurricane season are 1) a continuation of conditions that have been suppressing activity since 1995, and 2) A high likelihood of ENSO-neutral conditions (no El Niño or La Niña) during the peak months (July-September) of the season, but with lingering La Niña impacts perhaps into the summer.
This outlook considers the historical distribution of activity for these climate factors, uncertainties in ENSO, and the possibility of other unpredictable factors also influencing the season.
Historically, seasons with climate patterns similar to those expected this year have typically produced below normal activity, with some producing near-normal activity. Therefore, we estimate a 70% chance of a below-normal season, a 25% chance of a near-normal season, and only a 5% chance of an above normal season.
An important measure of total seasonal activity is NOAA’s Accumulated Cyclone Energy (ACE) index , which accounts for the combined strength and duration of tropical storms and hurricanes during the season. Based on the expected climate factors above, we estimate a 70% chance that the 2011 seasonal ACE range will be 45%-105% of the median. According to NOAA’s definitions of season strength, an ACE value below 94% of the 1981-2010 median indicates a below normal season, and a value of 94%-141% of the median indicates a near-normal season.
Consistent with the expected ACE range, other likely (70% chance) ranges of activity for 2011 are: 9-15 named storms, 5-8 hurricanes, and 1-3 major hurricanes.
We expect dominant features of the ongoing low activity era to prevail this season, including increased vertical wind shear, generally shorter-lived and weaker storms, and a reduced westward track to those storms. These conditions would likely be accentuated if the current La Niña-related circulation anomalies persist even after La Niña dissipates.
This outlook is generally consistent with newly emerging climate model forecasts. Predictions from the Climate Forecast System (CFS), the European Centre for Medium Range Weather Forecasting (ECMWF), and the EUROpean Seasonal to Inter-annual Prediction (EUROSIP) ensemble are all suggesting normal or below-normal tropical cyclone activity in the eastern Pacific this season, though their forecast skill for the region is quite limited at this lead time.
2. The ongoing low-activity hurricane era in the eastern Pacific
The eastern Pacific has experienced suppressed hurricane activity since 1995 (while the Atlantic Basin has experienced greatly enhanced activity). The expected continuation of this low-activity era, combined with ENSO-Neutral conditions and the possibility of lingering La Niña-related circulation anomalies, is the main reason we expect the 2011 hurricane season to be below-normal.
During 1995-2010, 63% of eastern Pacific hurricane seasons were below normal, 31% were near normal, only one (1997) was above normal due to an El Niño episode of near-record strength. Eastern Pacific seasons during this period averaged about 14 named storms, 7 hurricanes, and 3 major hurricanes, with an ACE value of 83% of the median. This value falls within NOAA’s definition for a below-normal season.
Several regional circulation patterns have been associated with this reduced activity. The Pacific ITCZ has shifted farther to the north, allowing for extensive southwesterly flow into the eastern tropical North Pacific. Also, the upper-level ridge over Mexico has been stronger than average, resulting in enhanced upper-level easterly winds. This combination of factors leads to increased vertical wind shear, which limits the number, intensity, and duration of the tropical storms and hurricanes. Also, these storms tend to form closer to Mexico and closer to cooler ocean temperatures, both of which limit their duration.
The levels of hurricane activity since 1995 in the eastern Pacific and the Atlantic basin contrast sharply with those of the preceding period 1982-1994. The eastern Pacific was much more active during this earlier period, while the Atlantic basin was more suppressed. This multi-decadal see-saw in hurricane season strength between the two regions is associated with the tropical multi-decadal signal (Chelliah and Bell 2004, Bell and Chelliah 2006). For the eastern Pacific, 62% of hurricane seasons during 1982-1994 were above normal, 31% were near normal, and only one season (1988) was below normal. Seasons during that period averaged about 18 named storms, 11 hurricanes, and 5-6 major hurricanes, with an ACE value of 162% of the median. This value falls within NOAA’s definition for an above-normal season.
3. The El Niño/ Southern Oscillation (ENSO)
ENSO is an important climate predictor for eastern Pacific hurricane activity. The three phases of ENSO are El Niño, La Niña, and Neutral. El Niño acts to reduce the vertical wind shear and is therefore more conducive to eastern Pacific hurricane activity, while Neutral and La Niña conditions increase the wind shear and suppresses the activity. These typical impacts can be strongly modulated by conditions associated with the tropical multi-decadal signal.
We expect ENSO-Neutral during the peak months of the 2011 eastern Pacific hurricane season, but with lingering La Niña impacts into the summer. Both ENSO-Neutral and La Niña conditions typically enhance the dominant features of the ongoing low-activity era. Currently, the 2010-11 La Niña episode is waning. Based on current observations and ENSO forecast models, NOAA’s CPC indicates that ENSO-Neutral conditions are likely during the peak months of the 2011 eastern Pacific hurricane season.
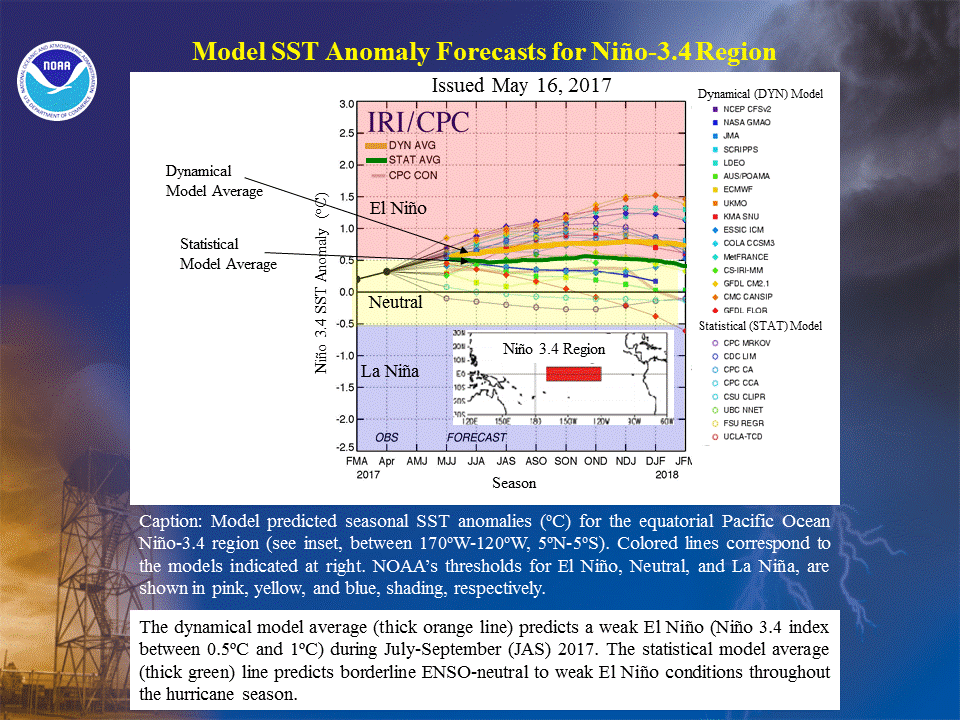
However, predicting the various phases of ENSO and their impacts is an ongoing scientific challenge facing climate scientists today. Such forecasts made during the spring generally have limited skill. The present uncertainty in the model forecasts is indicated by the large spread in predicted SST departures in the east-central equatorial Pacific during July-September 2011. Most models predict ENSO-Neutral conditions (defined by the CPC as SST departures between -0.5oC and +0.5oC) during this period. However, some models predict weak La Niña conditions (SST departures cooler than -0.5oC) while others predict weak El Niño conditions (SST departures above +0.5oC).

Wednesday, May 18, 2011

AOI dies, season prediction time

The AOI we've been following has died. All quiet for now, but the HCW will be re-lunched on May 21st. And EPAC predictions from Mexico suggest 13 named storms, 6 hurricanes, and 3 majors. Ok, season. It will defiantly be more active then last year according to Accuweather. 2-4 storms are expected in the CPAC (2-3 were anticipated last year, only one formed). In all, below normal season is expected for the CHPC's AOR (4 is normal, including crossovers and TD's).

Tuesday, May 17, 2011

Hurricane Preparedness Guide, Part 2, AOI looks decent

nce You Hear A Hurricane May Be Coming Your Way

  1. 1
    Keep in mind that some hurricanes are usually slow travelers. Once you hear about it, chances are you have several days to finalize your plans. Be careful, though; some hurricanes can go up to 80 km/h, especially near the Atlantic Provinces of Canada.
  2. 2
    Be sure you are well supplied with any prescription drugs that you or your family take on a regular basis. This can be a daunting task as some insurers will not honor refills until the last refill is nearly used up or has run out. If necessary, drugs must be purchased without insurance; weeks may go by without the ability to get refills, putting your health (or even your life) at risk.
  3. 3
    Put all of your valuables into clear plastic bags or high off the floor.
  4. 4
    Cook all raw meats in your refrigerator and freeze them. They will help keep the other food cold and you can take them out one at a time for meals that do not require cooking.
  5. 5
    Put all the ice that you have in your freezer into plastic bags. Fill all spaces in your freezer with bags of ice. Keep your refrigerator door closed as much as possible to minimize thawing. Freeze water bottles, too.
  6. 6
    Make sure that you have a BBQ and lots of charcoal or propane so that you can cook and heat foods for meals. Small propane bottles can also connect to lamps, heaters, and cooking appliances.
  7. 7
    Stay on top of the news. How often you watch the Weather Channel is up to you, but if you start to feel overwhelmed or panicky, turn it off. You can always turn the news back on when you feel better. Either that, or ask a trusted neighbor to let you know when a hurricane will likely head your way so you can be informed when news watching is absolutely vital. It may be a good idea to evacuate your area beforehand, since traffic will be a problem during a mandatory evacuation order.
  8. 8
    Decide whether or not you will evacuate. It's best to get out of town before it becomes mandatory, or even recommended. If you wait until the last minute, an hour will have passed before you get out of your driveway.
  9. 9
    Inform your family and friends about your decision. They will rest easier if they know what you plan to do and why.

editIn the Event You Decide to Evacuate

  1. 1
    Determine when and how you will evacuate. If you don't have a car, don't be too proud to ask others for help. If you do, leaving at an off-hour such as 2am is the best way to assure minimal traffic.
  2. 2
    Consult a map in accordance to the advice given on the news. For example, if you live in Florida or Louisiana and the hurricane is said to be heading northwest, you'll want to have a route that heads northeast or north whichever one is safer and shorter.
  3. 3
    Contact any friends or family that you may need to stay with during this time.
  4. 4
    Pack your car, not only with necessities such as food (which should be in your Hurricane Preparedness Kit) clothing and medicine, but photos and important papers such as birth certificates and shot records leaving, pack things that you would not want to be without both for your time away from home and in the event all is lost. A good rule of thumb is to plan about a week's worth of away time (don't forget the laundry soap, etc. just in case it's longer). Choose carefully. You presumably have a limited amount of space in your vehicle and space for humans is needed too. Make sure you have spare oil and consider taking an extra gas tank if you can safely carry one on or in your vehicle (gas stations on evacuation routes sometimes run out of gas).
  5. 5
    Protect your home and yard and then leave as far in advance of landfall as is possible and prudent. (For steps on protecting the home, see below).
  6. 6
    If you will be staying with friends, family, or in a hotel (don't count on it, have a back up plan even if you've made reservations ahead of time) withdraw sufficient cash for two weeks. ATMs and banks may not be operating in the aftermath of a major hurricane and some credit card machines will be down. If you expect to be displaced, a family of four needs approximately $500 to last a week if you'll be staying in hotels. You'll need less than that if you will be staying with friends, relatives or in a shelter.
  7. 7
    Make sure your cell phone and extra cell phone batteries (get them if you do not already have some) are charged before leaving or before the power can go out. You can charge them up with the power from your car if you have a DC to AC converter.
  8. 8
    Stay calm and collected, especially when you are around little kids who might easily get scared when their parents are stressed out. Around small children, make the hurricane preparation/evacuation into an unexpected vacation or adventure.
  9. 9
    Double-check for last minute details. Is the power, gas, and water turned off? Do you have everything you need? Is the first driver well-rested or would another couple of hours of rest do him or her a world of good? Did you bring all your pets along? Leaving at 4am instead of 2am if you need to will still keep you out of the main flow of traffic, so there's no need to rush since any driver needs to stay on top of things especially during an evacuation.


edit If You Decide to Stay

  1. 1
    Take all measures to protect your home and property. It is not only your stuff you are protecting but yourself and your family who have stayed behind. If you have removable hurricane shutters, try to put them up at least two days before landfall. Holding a 25-pound aluminum shutter while balancing on a ladder in 74 mph winds is no fun and can lead to bad things. If you are using plywood, get your wood and nails early.

    • There is a risk of less-than-ideal folks wandering around the neighborhood possibly looking for an empty home to rob. Lock all doors and windows, place heavy, opaque drapes in front of windows to prevent outside eyes from looking in, and if you have them and if you live in the US, load up on several rounds of ammunition for your rifles, shotguns, handguns, and pistols prior to the hurricane's arrival. Advertise that there are weapons in the vicinity. Don't try this in Canada though -- you'll get arrested.
  2. 2
    Move into your home or garage all pots, patio furniture, grills and anything else that can blow around. Do not sink any furniture into a swimming pool, this is an old-wives-tale and a very bad idea.
  3. 3
    Make a list of everything you will need if you are stranded and without power for two weeks. See "Things You'll Need" below.
  4. 4
    Designate a "safe room" in case your home's integrity is compromised. The "safe room" should have no windows or exterior doors and preferably only one interior door. Bring in a mattress to lean upright against the door and pre-stock it with a radio, batteries, flashlight and enough food, water and pre-moistened napkins to last 12 hours. Make sure all household members know that they are to run to this room once the wind starts rushing into the home. All pets, if you have them, must go here too during the hurricane. Keep any equipment your pet may need, i.e. water or cat litter, in this room too.
  5. 5
    Stay as far away from windows and doors from the moment of landfall. If the power has gone out, listen for wind and rain that will steadily increase as the hurricane nears.
  6. 6
    Extinguish all candles once the rain and winds reach thunderstorm levels. This is to assure they are not accidentally left lit when and if the winds start whipping through your home. A safe way to use candles is to put them in a saucepan, deeper than the candle is high, with shiny sides. The light will reflect off the ceiling and inside of the pot, and the candle will be protected from being knocked over. An inch or so of water in the pot isn't a bad idea, either. However, if you smell gas, hear gas, or even suspect a gas leak, do not use candles. Use light sticks.
  7. 7
    Keep a radio on as the hurricane approaches. Often, the major radio stations will have special coverage in the local programs if a hurricane is coming.

    ITT Tech - CAD Degree

    ITT Tech CAD courses. 100+ Locations & Online Programs
    www.itt-tech.edu

    BeenVerified.com Website

    As Seen On TV - (Official Site) Instant Background Checks
    www.BeenVerified.com

    Emergency Evacuation Kits

    From Home to Shelter... ...72 hour Emergency Kit
    www.PHI-EMsolutions.com

edit Tips

  • Stay away from flying and sharp objects.
  • You should not think twice about leaving if: (a) you are under a mandatory evacuation order; (b) a Category 3–5 hurricane is likely and you are within 100 miles of shore; (c) you live in a manufactured home or camper and a hurricane of any strength is on its way to you; or (d) you cannot shutter or board-up your home.
  • Communication and teamwork is key. Stick together, work together and heed the instructions of safety officials.
  • You can pick up a car refrigerator for under $50. It runs off your car battery. Though not large, a car fridge can store at least a day's preparations and may of course be refilled as needed.
  • Bring car activities for kids (and adults).
  • Make sure that you have enough time to get out of the danger zone, taking into account current traffic conditions based on news reports. The last thing you want is to be trapped in your car while the storm is coming ashore. Get out early by the fastest route possible.
  • Not everyone has to do all of these steps or tips, if you are not directly or close to the eye of the storm. In this case, the most you can expect are heavy rains, and winds.
  • Do not use a toilet if there's no water in the tank to flush it. The waste left there will produce a smell that is most unpleasant in your home. Each flush takes over a gallon of water. You could line the bowl with a garbage bag and then remove the waste from the home.
  • A 5 gallon bucket lined with a garbage bag makes a good emergency toilet. But this method will use up a lot of garbage bags in a short amount of time; an alternative is to dig a hole in the yard and use it for an emergency toilet. You may also sprinkle cat litter in the 5 gallon bucket between uses. This will absorb liquid and allow multiple uses of a bag before removal to the outside of the house.
  • If you have an outhouse or a composting toilet , use it.

edit Warnings

  • Heed all directions of both the Red Cross and government officials.
  • Throughout the preparatory phase and the storm itself, do not let your love of adventure overwhelm your common sense.
  • Don't do what Torontonians did in 1954 when Hurricane Hazel came to town, which was disregarding the warnings. If there is a hurricane warning or watch issued for your area, believe it, no matter where you live.
  • Remember, hurricanes can strike anywhere from the Carribean to the Eastern coast of Canada.

edit Things You'll Need

  • Battery operated flashlights are fine if the power is out for a short time. The new LED flashlights work well, as long as a spotlight isn't needed. Target and other stores have good ones in the $10 range that drop into a pocket and run on AA and AAA cells. They're great for personal lights, and the batteries last five to ten times as long as with regular incandescent flashlights. Additionally, LED conversion bulbs are available on the Internet for more popular brands of flashlights.
  • After a couple of days you will need candles for light. Buy big decorative candles that will burn for days. Keep lanterns/candles in frequently used locations, such as the bathroom counter, next to the door, and on your bedroom nightstand. IF there are gas leaks, explosive chemicals in your area, do NOT use candles, if you do, watch them to prevent fire, especially if children are with you.
  • "Self Powered Lights" and "Self Powered Radios". This equipment is either solar powered, and/or has a "crank up" generator built into the light and the radio. Find the lights at the local Wal*Mart, the radios at the local Radio Shack and/or the Internet. This will save you money on batteries, IF you can find any, since they'll be sold out WEEKS before a storm hits you. Some of these models will also charge cell phones.
  • Glow sticks. Can be found in the Wal*Mart and sporting goods dealers. Safer than candles, in case there are gas leaks, explosive,flammable chemicals in your area.
  • Solar powered garden lights. You can charge them up in the sun by day and use them indoors for lighting at night.
  • Battery-operated radio
  • Canned goods and can opener, fruits and vegetables and other foods that do not require refrigeration.
  • Water (at least one gallon daily per person with a seven-day supply). You can also fill up bathtubs if you close or seal the drains.
  • Bleach. In the event that water enters your home, you will need to get it out and then kill any microbes that remain.
  • Take highly-valued items with you or, for those items staying in the home, wrap in plastic or place in plastic bags. Even if you are riding out the storm, consider placing photos, insurance papers and other important papers in sealed bags.
  • Corded phone. Even if your electricity is out, your telephone may still work. Cordless phones still require electricity, so plug in a corded phone, and you may be surprised.
  • Cell phone and extra charged batteries. Some of the "Self Powered Radios" and "Self Powered Flashlights" allow you to keep your cell phone charged. IF the cell phone towers are damaged, destroyed, cell phones will be no good.
  • A DC to AC inverter.
  • Pre-moistened towelettes.
  • Battery-powered fans will be very appreciated if the power is out.
  • Lots of batteries of all sizes (you can always use later what is not used during the storm). Consider buying a car battery to power battery operated devices in the home.
  • Make sure each person has their own flashlight and battery supply, in case you have to separate.
  • A good supply of all prescription drugs.
  • A first-aid kit.
  • Optional but helpful is one pair of wading pants for each member of the family, or at least the adults of the household. If you live in an area prone to flooding, you do not want to be walking around with your skin exposed to contaminated water if there is a need, after the storm, to walk from the home.
  • Plenty of large plastic garbage bags to dispose of human waste and other garbage.
  • Supply of Toilet Paper, and other toiletries as needed.
  • At least one 5-gallon bucket and cat litter (the bio-degradable kind) for toilet use.
  • A pocket knife for cutting things.
The AOI looks decent right now, but it is moving inland soon and is expected to dissipate in about 48 hours. Now is a good time to prepare, use this AOI as a test system to what will likely happen in August or September.  

Here are the types of effects expected:
Up to 5 inches of rain
Minor flodding
High waves

 Interests in the area should monitor this blog for additional info.

How to prepare for a Hurricane Guide, Part 1, interesting model stuff, no change in AOI for now

At the Beginning of Hurricane Season (right now)


  1. Double-check to ensure the supplies in your Hurricane Preparedness Kit are both well-stocked and fresh. Inflate air beds to ensure they don't need patching or replacing. Check expiration dates on canned foods. Use a battery tester so you know they will work when you need them to (most batteries have a tester already attached to the package, but you can buy one separately if you want to).

  2. Recognize that your hot water heater contains 50 to 75 gallons of fresh drinking water. The water in a hot water tank can keep one person alive and healthy for more than a month. Attach a garden hose to the drain valve. Run water out of the tank to remove any built up sediment that has collected at the bottom of the tank. To get the water out of the tank after a storm you will need to open the plumbing system by opening any hot water faucet in the house. This will release the vacuum in the tank. You must turn off the electrical breaker to the hot water tank or unplug it to prevent damage if the electricity is restored before water service.

  3. Purchase a generator. Generally, a generator should be big enough to run your refrigerator, a lamp or two, and any fans. If you absolutely must have air conditioning, be prepared to pay handsomely for a generator that can handle it. Search the web for generator wattage calculators to make sure you don't buy more generator than you need - your wallet will thank you at the gas pump.

    • Purchase several 5-gallon gas cans. Fuel is usually scarce after a hurricane, and many stations even limit the amount of gas you can purchase after waiting in line. Having multiple cans will allow you to stock up. Buy a bottle of fuel stabilizer for when the power is restored. Mix this with your gas so that it will keep until you are able to use it. Also, fill and run your generator with the mixture for about 10 minutes so that the fuel system does not gum up while in storage. Change the oil and/or filter before you store it, that way it's nice and fresh next season.
    • If you already have a generator, make sure it is in working order before hurricane season. There is nothing worse than finding out that your generator investment needs repairs after you need to use it.
    • If you are unable to purchase a generator, buy a DC to AC converter for your car. With it you will use your car as a portable electric generator. They cost $25 to $100 and are available in the automotive section of department stores. If you should lose power to your house, you will be able run a radio, TV, light, refrigerator, or other low wattage appliances from your car. You will need a heavy duty extension cord to run the power into your house.
    • Do not run the car or any gasoline generator in the garage as the carbon monoxide poisoning could kill you.
  4. Perform maintenance on the car you will be evacuating with if it becomes necessary. When's the last time you changed the oil or the filter? Is the battery fully charged? Have you replaced the spare that you had to use the last time you evacuated? Since hurricane season happens during the warmer months, make sure your coolant is topped off as well.
  5. Buy a bicycle, if you don't already own one, so that you will have a backup mode of transportation. After a big storm hits there may not be any gasoline available for days or even weeks because of power outages and the gas pumps not working. If your neighborhood is destroyed you will be able to go for supplies or even ride out of the area. Make certain that the bike tires are pumped up before a storm hits. Have an inner tube patch kit and an air pump, too.
  6. Watch or listen to the news to learn when a hurricane is approaching. This will help you create a plan of action.
  7. Continue keeping in touch with your friends and family. They will gain comfort just knowing where you are, how you are faring, and how close the storm is to you. If you are in an area that is on the outskirts of the storm, tell them. Assure them that you are all doing good. Remember, they only know what they are told on the TV and their imagination runs wild. If you lose your telephone power, call them at least once with your cell phone, to tell them you do not have phone service, and that you will call as soon as it is restored. This way you do not have to use up your cell phone minutes which should be saved for emergencies

The AOI has not changed much these hours, but still something to watch. According tho the NHC  Experimental graphic, there is a 20% to 40% chance of development. Still, no mention on TWO.

The GFS model looks interesting these days,  with the latest run shows a few tropcial disturbances in the EPAC throughout the month of May, with one 1004-mb TD foretasted in a few days.  This suggest a pattern similar to August 2010 tropical activity wise. I know its only May, by it appears that we'll get going around June 5-12. Interesting.

Monday, May 16, 2011

AOI re-intensifies, La Nina appears to have gone, now in Neutral

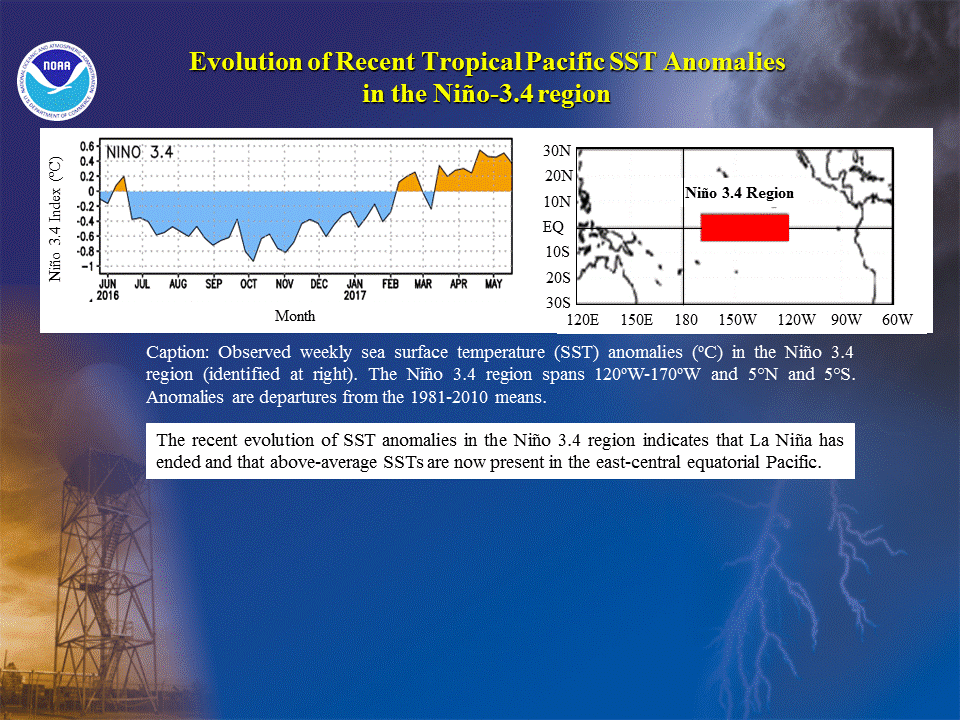
The AOI's convection has increasing again and despite no mention on the TWO, it looks ok. And the La Nina has weakened further, and we are now in a Neutral pattern.

Here's the official numbers (from the CPC site)
Niño 4 -0.3ºC
Niño 3.4 -0.4ºC
Niño 3 -0.2ºC
Niño1+2 0.9ºC


and here is the SST graphics (from BajaInsider):
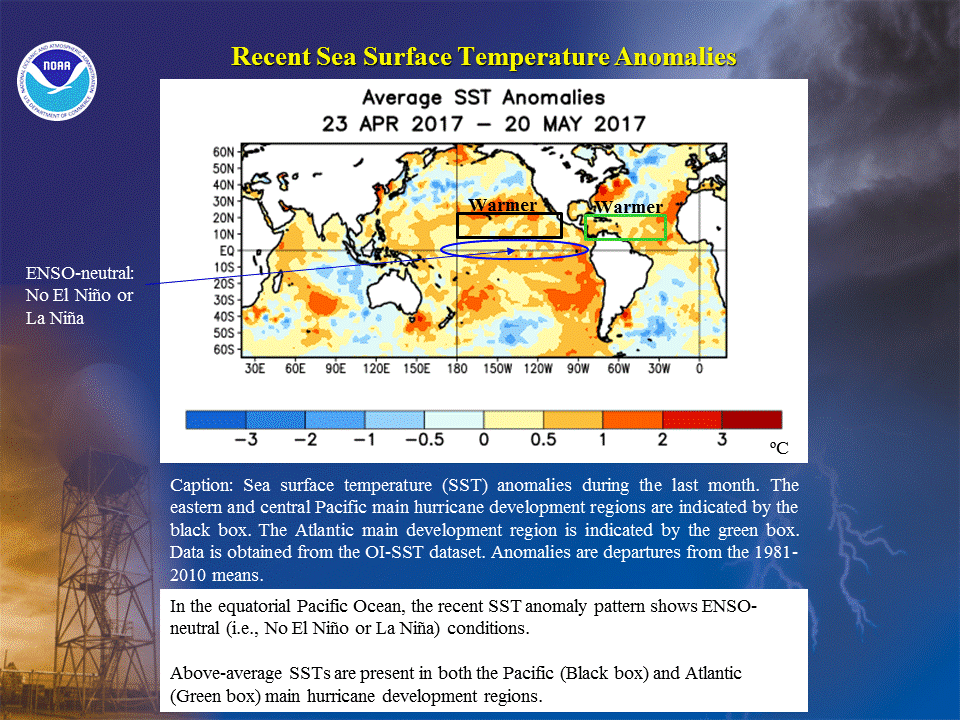
And here's a look at the SST anomaly (from NOAA):


How to read a surface chart, Part 2, AOI weakens slighly

The AOI has became less organized, though the EPAC remains tropcial active. Environmental conditions are gradually becoming more favorable for development.

How to read a surface chart, p2

The first surface charts were created in the middle 18th century from information from reporting stations. Through much of weather forecasting history most of the tools used to predict the weather come from each of these stations. It is only in recent years that satellite imagery, radar and other high-tech tools have supplanted the station report as the most valuable tool in forecasting. Today, through the internet, the National Weather Service also takes in data from thousands of civilian weather stations, connected to home computers around the globe. There are more than Surface Chart examply of a Station Model650 civilian reporting stations in Los Angeles alone. This large number of data points are obviously not plotted on the weather charts we see here, but add to the amount of data and understanding of weather anomalies and future forecasting techniques.
Therefore, it is arguably said, that the station model is the most important weather feature on a surface chart, as almost all other features are drawn from its data. The station model is in fact, jam packed with lots of information in a tiny little space. Unfortunately, to conserve space on the map one needs to write in code. Station models are coded to express almost all weather phenomenon. From the station model ascertain weather closer to you and if you are a sailor, predict the best course to plot for the wind and seas.
Station models are also probably the most prolific of all features on the surface chart as well. Looking like so many tiny golf course flags scattered haphazardly across the map, most are airports and military installations with calibrated instrumentation. Some reporting stations are ships as the example above shows. This is most likely the US Coast Guard Cutter running interdiction off the coast of Baja. There is also a seemingly endless number of symbols applied to Station Models and we will cover the most significant. There are so many different symbols that in my research I did not find one site that defined all of them. (here are some of the best examples found... Station Model Symbols01 Surface Model Symbols02 and Station Model Symbols03)
Your browser does not support inline frames or is currently configured not to display inline frames. The graphic left shows a majority of the information provided in a standard Station Model. Click in the descriptive titles to learn more about each of the weather characteristics encoded in a Station Report.
There is additional data that can be included in the Station Model, but these are the most common and most useful to those using surface charts to predict the weather in their area.
The first frame shows a semi-complete Station Report. By clicking on Layers 1 and two you can view the definitions of each of the code locations.
If you want to test your understanding of Station Reports and Surface Charts click here to see the World Detail Surface Chart for today (3mb PDF)

Sunday, May 15, 2011

AOI better orgnaized

The new AOI has gotten better organized over the past hour or so. However, the convection has diminished. It will be interesting to see how the system fares, but there has been no mention of this system on the NHC TWO. Still, not bad looking system. 

How to read a surface chart, Happy hurricane season, 3rd AOI for the season

And the day we have all been waiting for, it is May 15, 2011, the start of the 2011 Pacific hurricane season. Now, today we'll tell you how to read a surface chart, but before we get started my readers can guess where I got my information from (Hint: It is one of the link on the top of this page). The winner will get a free invitation to the ##hurricanes IRC channel. 

Let' get started:

What is a Surface Chart? ( Click here to see the current Eastern Pacific Surface Chart) It is a map of weather conditions and forecasts for the next period. According to Answers.com a Surface Chart is as follows:
"An analyzed synoptic chart of surface weather observations; essentially, a surface chart shows the distribution of sea-level pressure (therefore, the positions of highs, lows, ridges, and troughs) and the location and nature of fronts and air masses, plus the symbols of occurring weather phenomena, analysis of pressure tendency (isobars), and indications of the movement of pressure systems and fronts. Also known as sea-level chart; sea-level-pressure chart; surface map. "
High Pressure SymbolLow Pressure symbolThe most noticeable features on a Surface Chart are the High and Low pressure systems. Indicated by large letters, and when in color Highs are blue and Lows are red. In the northern hemisphere High pressure systems orbit clockwise, Low pressure systems orbit counter-clockwise. Movement of a Low pressure system is indicated by an arrow indicating direction of movement and a Low Pressure end point, located at the forecast position of the system at the end of the forecast period. Movement of a High is also indicated with an arrow of direction of movement and a High pressure end point. The direction of movement arrow is sometimes omitted if space doesn't allow. If the system is not moving "STATIONARY" is usually printed next to the system. The current barometric pressure reading for the system is indicated in millibars located usually above the symbol and underlined, (i.e. 1006). The future barometric pressure can be indicated by an underlined two digit number, near the future location of the system (i.e. 04 ) If the system is new, rapidly strengthening or this can be indicated with the written words such as "DISSIPATING, NEW or RAPIDLY STRENGTHENING" Hurricane strength conditions are indicated with "XX".
Isobars and Wind on Surface ChartsThe reason our Eastern Pacific Hurricane usually move off into the Pacific is this counter-clockwise rotation of arrow SWthese extreme Low pressures. Like a rolling tire, the rotating action drives them to the southwest. Other environmental factors push them more to the north, and as the northern hemisphere cools the jet stream pushes them back toward the northeast and sometimes into Baja after late July.
Isobars are the long lines forming unusual shapes on a surface chart. and are directly associated with Highs and Lows and relative barometric pressures. indicated in solid or dotted lines, brown on color charts, these are rough demarcations of barometric pressure, taken from reporting stations. The closer together the lines, the greater the wind in that area. Wind does not blow parallel to these lines, because of the earth's rotation, but slightly off axis to a point of lower pressure. In the case of intense winds "DEVELOPING GALE" or "GALE" will be written on the chart
Type of fronts on Surface ChartsFronts are a very visible and important feature too, although not usually for hurricane weather. In a color chart cold fronts are indicated in blue, Warm fronts in red, stationary fronts in red and blue and occluded fronts in purple. Fronts are a line, indicating position of the front. Warm Fronts have semi-circles, Cold Fronts triangles and stationary fronts have both. The side of the line on which the added symbols exist indicate the direction of flow from the front. Stationary fronts have both semi-circles and triangle on opposing sides of the line, indicating that the front isn't moving. Occluded front is where cold air has overtaken a warm front, using both triangles and semi-circles in purple, indicating the movement of the front."
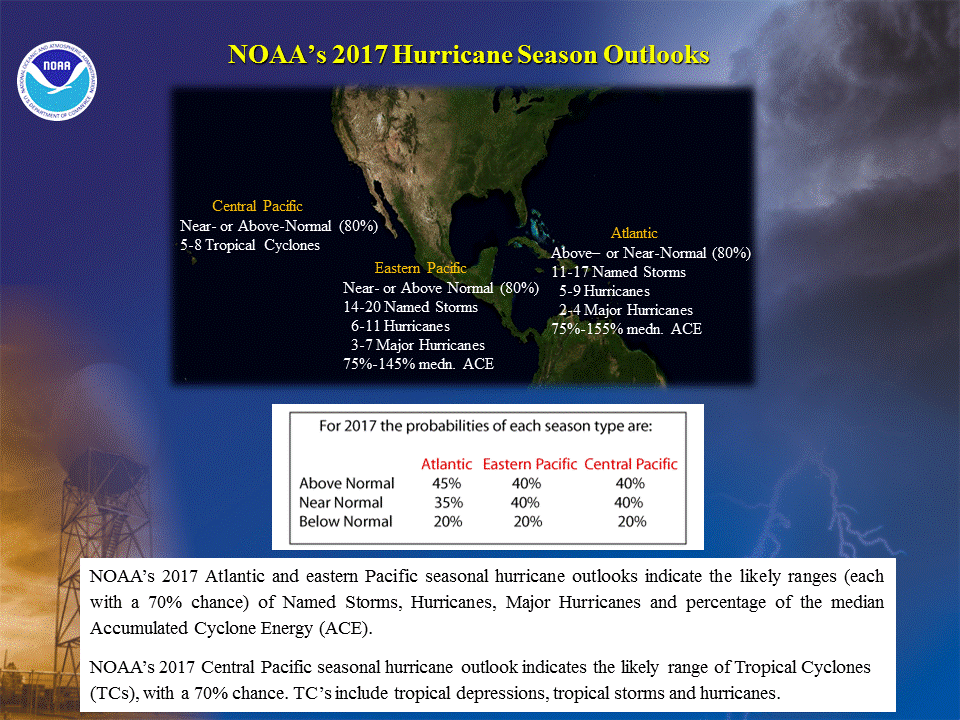
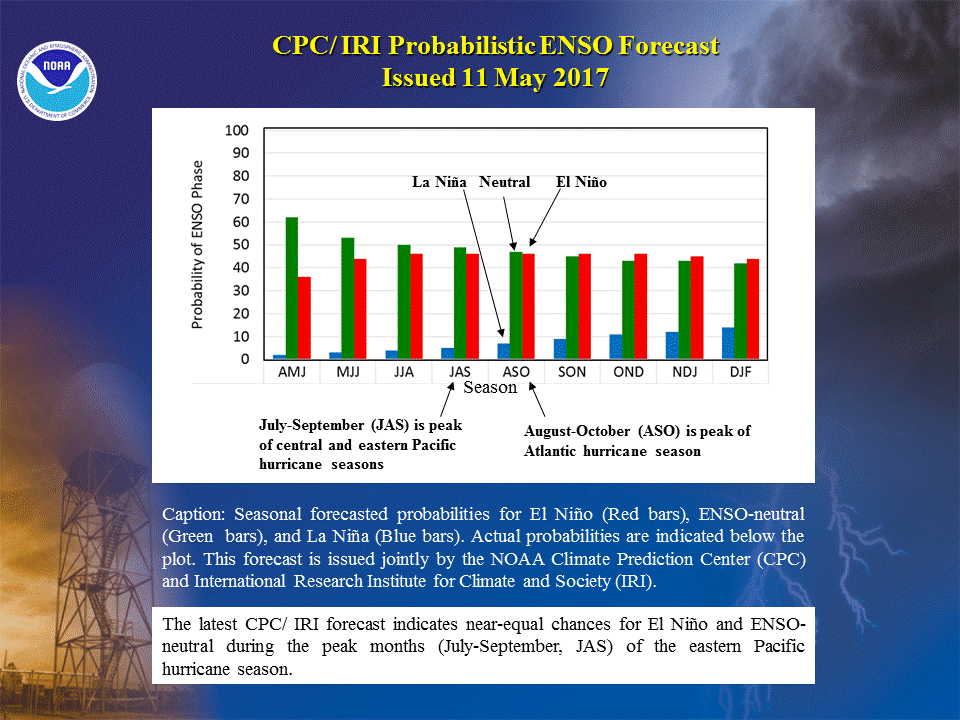
We have our 3rd AOI of the season. Does not looks like much, but an organized burst of convection is present. The air is too dry for significant development, but it is at east something to watch. It is located near 111 W, 9 N.

Our next post will be this afternoon.

Saturday, May 14, 2011

EPAC season almost here!

Yes, its that time of year again, Time for the 2011 PHS to start! We're starting to see more convection in the basin, and hopefully, we'll get started with the season soon.

Monday, May 9, 2011

Hurricne season very near, La Nina gone

Check your calender, everybody, Today is May 9, six days away form hurricane season. The GFS forecasts a storm to the develop in ate May as environmental conditions are becoming more favorable for tropical cyclone formation. La Nina appears to be gone, and we are now in a neutral weather pattern. BTW, hurricane week is on Sunday, see schedule below.  

Monday, April 25, 2011

AOI disspates, all quiet

Spring break and Easter is over. No more Easter bunnies. the AOI has dissipated and it is all quiet for now. Wind shear is increase, one more month till the lid comes off. I can't wait for the season to start!

Friday, April 22, 2011

90E may form in a few days

A second AOI of 2011 has formed. Not expected to do much , but it could become 90E. However, this is a good sign that Hurricane Season is starting. MJO forecast show MJO to become negative around May 5 and remain that way till May 20. Then, it will be neutral or positive through the remainder of May and into early June.

Monday, April 18, 2011

Countdown to hurricane season begins

We are one getting closer to hurricane season every week. As of this afternoon, we are 26 days, 14 hours, and 46 minutes away from the start of the 2011 PHS. Th end of the season lasts 200 days, so we are 226 days, 14 hours, and 46 minuets away from hurricane season as well.


Now, we quote Dr. Steve Lyons with some EPAC climatology
"May 15th, is the start of the 2009 East Pacific hurricane season, about 2 weeks earlier than the Atlantic Basin hurricane season begins (June 1). Both end November 30th. These dates have been set to encapsulate well over 90% of tropical cyclones that form in each basin. On rare occasions we find development before each season "officially" begins and/or after the season "officially" ends. The last time we had an early start to the East Pacific hurricane season was in 1996 when a tropical depression formed on May 13th, two days before the official start dated; the following day it became the first tropical storm that year, and to this day remains nameless, the second tropical storm to form that year was named "Alma." It turns out that on-average the East Pacific is more active than the Atlantic Basin, and this is the case in most but not all years (2005 being the clearest recent example). Since the satellite era began in 1965 tropical cyclone annual averages are 16 tropical storms, 8 of those becoming hurricanes. Of particular interest is the fact that prior to being able to see tropical cyclones in this area of the world with weather satellites, many tropical cyclones were missed as this is not a typical high ship traffic area, hence weather reports from them have been historically sparse.

Tropical cyclone averages were 8 named storms, 3 of those becoming hurricanes in our historical record from 1949-1964. Yes, more than half of all tropical storms and two-thirds of hurricanes went undetected before the satellite era and very likely many ships got into much rougher weather than they were expecting! Prior to the satellite era that began around the time I was in 6th grade (1965), meteorologists had thought the Atlantic Basin was a far more active tropical cyclone region compared to the East Pacific. It is interesting how wrong we can be when we make assumptions without accurate information!


AVERAGES TROPICAL STORMS HURRICANES
1949-1964 8 3


A large majority of tropical cyclone tracks are toward west of west-northwest and out to sea away from land. However each year is unique, some years have many more tracks that turn north and/or northeast toward land than other years. These track differences are related to changes in steering from one year to the next. El Nino years are more likely to see landfalls in Mexico and remnant tropical cyclones affecting California and the southwest U.S. Locations for formation of tropical cyclones in the East Pacific are the narrowest in the world, with a local maximum located near 15N latitude, 110W longitude.

The two most common U.S. impacts from East Pacific tropical cyclones are 1) high surf in Southern California from distant tropical storms and hurricanes and 2) flooding rains in the U.S. southwest that can at times spread across California and well into the central U.S. Surf can exceed twenty feet on south facing beaches of Southern California from swells coming from hurricanes offshore from Mexico. One year those swells were so high, some waves broke over the top of the Huntington Beach pier, the long-shore currents in the water were two to four miles per hour toward the north, and rip currents drown many beach goers. Flood disasters from remnants of tropical cyclones in California, Arizona, New Mexico and for that matter the entire southwest U.S. are too numerous to list. In 1939, one hurricane did not weaken over the cool California current as it headed toward that state. It made landfall near Long Beach and brought damaging tropical storm force winds, high surf and flooding rains. In 1972, Hurricane Hyacinth moved toward Southern California and although it weakened it struck San Diego as a tropical depression. So no, it is not impossible for California to be struck by a tropical storm, but it is rare, and far less rare for remnants of tropical cyclones to drift over Southern California and occasionally bring flooding rains in months that typically see no rain! I remember dancing in the street in heavy rains in the late summer of 1967 as hurricane "Katrina" moved up the Gulf of California and brought rains to San Diego and beyond. Yes, that was an interesting year with Hippies, Flower Children, motorcycle gangs and tropical cyclone remnants leaving their marks on my home state.
So before you head on that vacation to Baja, Mexico or Central America, check with The Weather Channel for any tropical cyclone threats that might affect you vacation destination. Oh and those of you in Southern California, you might win a party bet with that 1939 Long Beach landfall, just remember you are routinely vulnerable at the beach in high surf that can come from distant or not so distant East Pacific hurricanes.
"
The GFS storm we mentioned last week is turning into a modelstorm. Still, not bad for April.

Friday, April 15, 2011

GFS predicts EPAC storms in a few days,

Today is April 15, one moth away from the start of Hurricane season! Yet, we already have something to talk about. The storm (see header) looks a bit disorganized, and is located at 5N put for an April system, it is not bad, not bad at all. The question is will it be one of those GFS "model storms" that do not do anything at all? Only time will tell, but it is something interesting to follow at least.


Monday, April 11, 2011

How to prepare for the 2011 PHS

Note: Review these tips on Hurricane Week (May 15-21)

  1. Keep a Hurricane Preparedness Kit packed (see "Things You'll Need"). This assures that you will lessen the amount of things you'll have to do when the time comes. Also, items such as batteries are easier to find when everyone else isn't panicking. As a bonus, if any other event, such as a fire occurs, you'll be prepared for that as well.

  2. Create a "take box". The take box should have everything you need to reconstruct your life in the event you evacuate and everything is lost. Passports; birth, wedding, adoption, divorce, and armed service separation certificates; copies of insurance policies; mortgage information; house and car title; large purchase receipts. You get the idea. If you have a scanner, save yourself space and heartbreak by scanning family albums and images of other keepsakes, burn those to CD and keep a copy in your take box, or make a copy of all your pictures, videos, music and documents on a external hard drive that you can keep in your take box. But remember that CD's can malfunction. Make sure you take along the original documents, if possible, make copies of them. The CD is just for convenience when shown to officials.

  3. Discuss and practice a disaster plan with your family.  Make sure everyone in the family knows who to contact (and how to contact them) as an out of area contact. Make sure kids know enough information so that an adult can get in touch with that person should sudden evacuation be necessary when you aren't near them. Practice this, and make other back up plans. This can be as involved as you like, but keep in mind the ages and temperaments of individuals to assure everything runs smoothly in the event you have to evacuate immediately.

  4. Learn how to turn off the gas and power to your home and make sure that all tools needed for the job are easily accessible. If you're not sure, speak with the gas or electric company for instructions. You don't want to be running around at the last minute trying to figure out how to do these things.

  5. Ensure that insurance matters are kept up to date. Hurricane season is not the time to buy flood insurance since it's either unavailable or very very very very very very very expensive.  Note: most regular home insurance does not include flood coverage in the policy, so you'll have to buy this separately.

  6. Keep in touch with friends and family that are out of the potential disaster area, and make arrangements to stay with them, in case you have to evacuate.

  7. Have someone remove dead trees and dead tree limbs and evaluate the health of any trees near enough to fall on your (or your neighbor's) house.
  8.                                                                                                                                                            Check this blog regularly. Very important information. If you can't check one fo th elink listed blew the titles.  Chances are that this blog will give you the info you need.

Now, we'll announce the dates for hurricane preparedness week
May 15-Introduction. What is the EPAC all about? How to read a surface chart?
May 16-Hurricane Preparedness
May 17-Hurricane Preparedness, cont
May 18-Hurricane Forecast
May 19-Hurricane Names and other data sources
May 20-Hurricane Damage
May 21-Hurricane History

Note:these dates are subject to change

Saturday, April 2, 2011

2011 Predictions

Its April, in a season under the name Spring. A month past a hurricane conference, which confirmed that Agatha nor Frank got retired. We are still in off-season, but we are getting there, getting close to hurricane week May 15-21.

It is time for our predictions. The La Nina that lead to the least active since since 1977 is gone at last. a neutral should appear by May, and an El Nino by October. Typically, under neutral conditions, we get 14-16 named storms. Waters are much warmer than last year. However, the pressure forecast look fairly balancedm and since hurricanes help balance out the pressures, they would be less hurricanes and the pressure over the tropcial Pacific. There is more ITCZ convection than normal this year, so that is a sign towards more activity. Our pre-season forecast goes for 15-4-3.  

The highest risk is the Mexican coast. I predict a lot of storms will form near the coast. In June and July, it will be boring. Form-intensify-die. In August, you will start to see a few major hurricanes, as upper level winds weaken over the tropical pacific. By mdi-August storms will start to threaten Mexican Riviera which extends from Acapulco to La Paz, but landfalls will be rare.  By late August, troughs will re-curve storms toward Mexico, and a landfalling Baja hurricane is likely during late August/early September. September will be quiet with only two storms expected, despite one forecasted to make landfall.

October becomes a dangerous moth. Three quick storms will from around Ocotber 7-15, including one major hurricane than re-curves and strikes Mexico. In all, the ACE will be near-normal, in the 83-92 range.

BTW, a Baja California weather center played an April Fools joke. They wrote  "A freak tropical storm is working its way up the Pacific side of the Baja peninsula and is forecast to make landfall somewhere along the Southern California coast."- sourced from Bajainsider.com

Closing 2010 recap

Finishing off 2010, the strangest thing happened. It's December 29, hurricane season is over, its the middle of winter for gods sake. In an area that has been devoid of activity through the year. Yet, 92C emerges into the EPAC and develops into Tropical storm Omkea. however, it dies the next day, but thats sure some surprise.